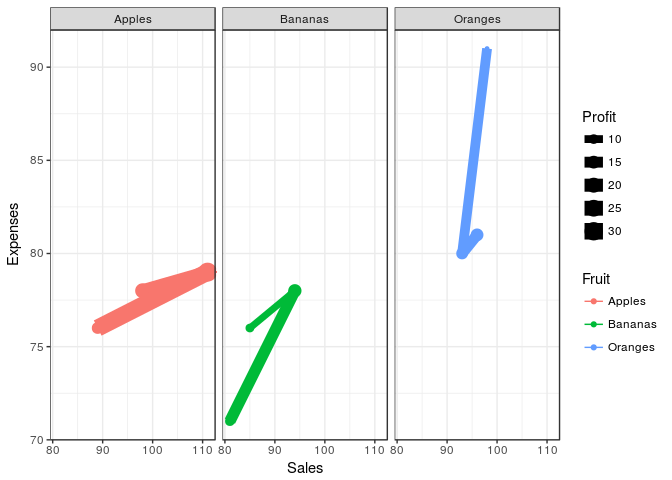
Skip to content

gganimate

Foreword

  • Snippets and results.

The gganimate package

The package does not make interactive charts, but introduces a time dimension in the display of static charts.

Static chart

We add a time dimension with frame = year. However, we are not using it and the data points look bunched up!

1
2
3
4
5
6
7
8
9
library(gapminder)
library(ggplot2)
theme_set(theme_bw())

p <- ggplot(gapminder, aes(gdpPercap, lifeExp, size = pop, color = continent, frame = year)) +
  geom_point() +
  scale_x_log10()

p

Dynamising a static chart

Moving frames can turn into a motion pictures! Let’s use frame = year.

1
2
3
library(gganimate)

gganimate(p)

We can see the results further down.

Saving the animation

1
2
3
4
5
gganimate(p, "img/gganimate/output.mp4")
gganimate(p, "img/gganimate/output.swf")
gganimate(p, "img/gganimate/output.html")

gganimate(p, "output.gif")

Rendering the animation (.gif):

And again…

 1
 2
 3
 4
 5
 6
 7
 8
 9
10
11
12
13
14
15
16
17
18
library(googleVis)

head(Fruits, 3)

##    Fruit Year Location Sales Expenses Profit       Date
## 1 Apples 2008     West    98       78     20 2008-12-31
## 2 Apples 2009     West   111       79     32 2009-12-31
## 3 Apples 2010     West    89       76     13 2010-12-31

library(ggplot2)
library(gganimate)

Fruits_a <- ggplot(Fruits, aes(x=Sales, y=Expenses, size = Profit, color = Fruit, frame = Year)) +
  geom_point() +
  geom_path(aes(cumulative = TRUE, group = Fruit)) +
  facet_wrap(~Fruit)

Fruits_a

1
2
3
gganimate(Fruits_a, interval = 5)

gganimate(Fruits_a, "Fruits_a.gif")

Rendering the animation (.gif):