ggedit
The ggedit package
The package is a ggplot2 editor. The ggedit package is part of RStudio Addins.
The procedure
We first generate a chart.
library(ggplot2)

p <- ggplot(mtcars, aes(x = hp, y = wt)) +
  geom_point() +
  geom_smooth(linetype=2, size=2, colour='#4876FF')

p
## `geom_smooth()` using method = 'loess' and formula 'y ~ x'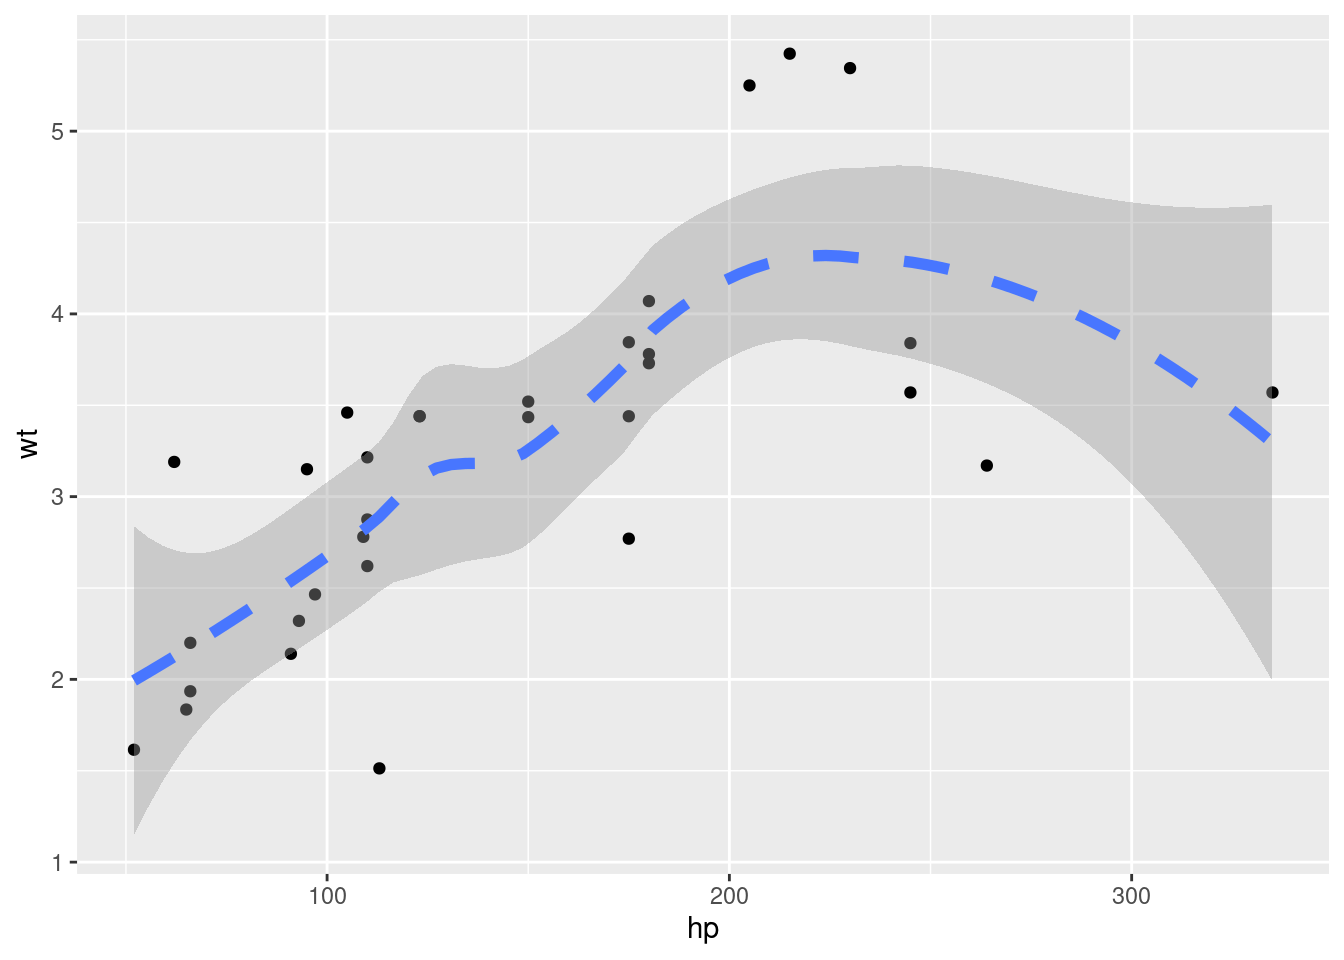
We then clone the original chart p and ‘ggedit’ p2. Or we highlight the ggplot2 plot and launch the addin.
p2 <- p

library(ggedit)

p2 <- ggedit(p)
Finally, we presh the ‘Done’ button and show the updated plot.
plot(p2)More about the object.
names(p2)