Static & interactive maps
European education
- Filling spatial vectors or polygons representing European countries with socio-economic data (making a choropleth map).
- Overlaying the polygons over a geographical map of Europe.
- Annotating the polygons with a numerical vector (using a joint or a merge).
Using the ggplot2 package:
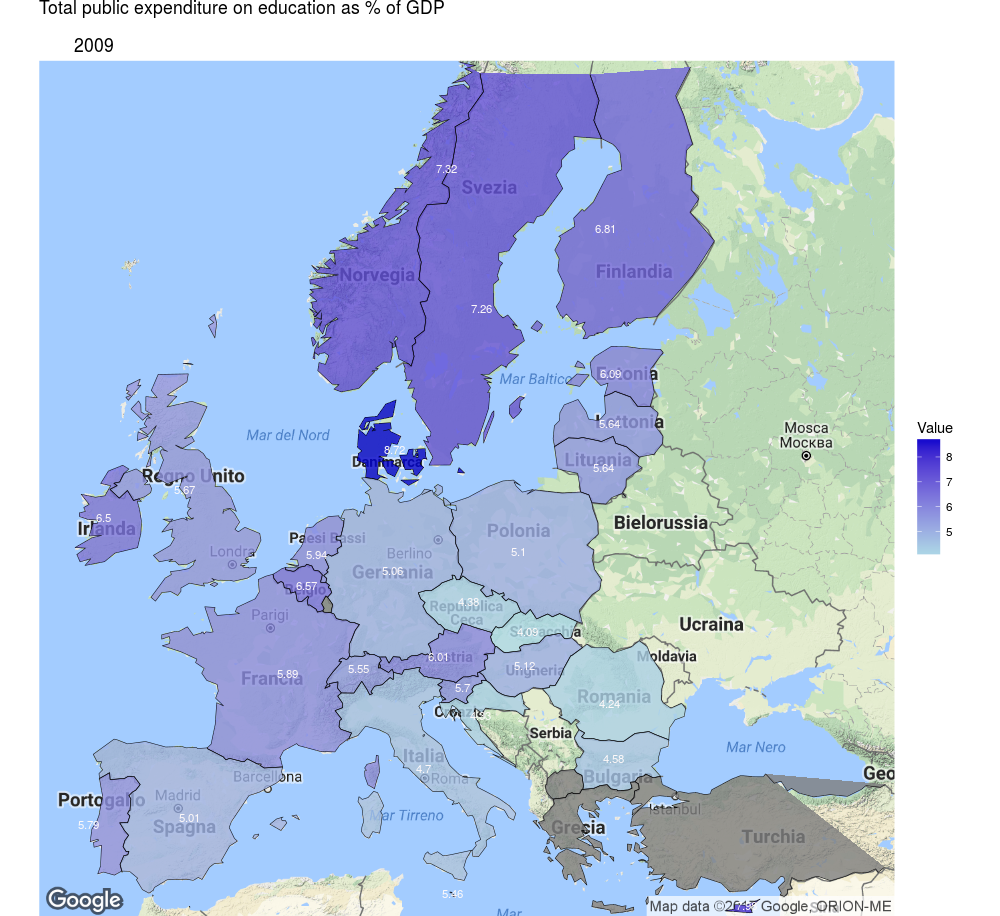
Using the leaflet package:
Sugar maple
- Filling spatial vectors or polygons representing north-eastern Canadian provinces and US states with economic data (making a choropleth map).
- Overlaying the polygons over a geographical map of North-East America.
- Adding the distribution area of a tree species (other spacial vector data).
- Modifying the numeric scale (discrete, continuous, logarithmic).
- Annotating the polygons with a numerical vector (using a joint or a merge).
Using the choroplethr package:
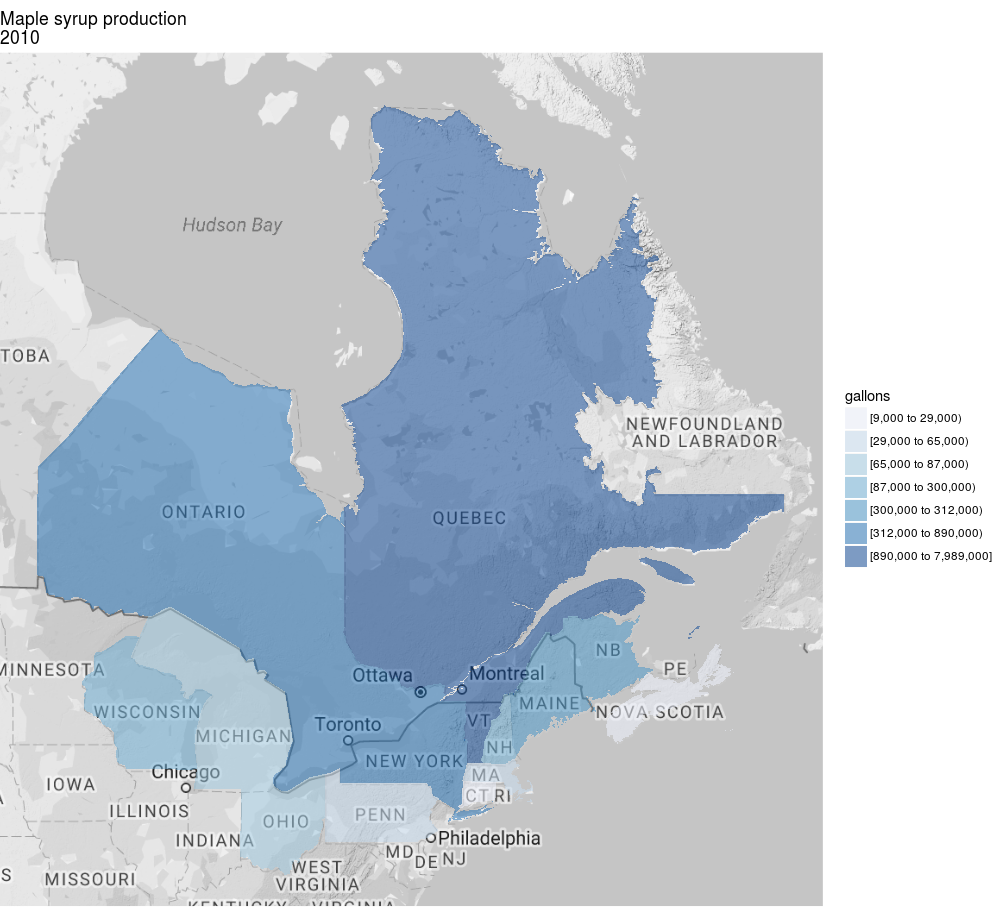
Using the choroplethr & ggplot2 packages:
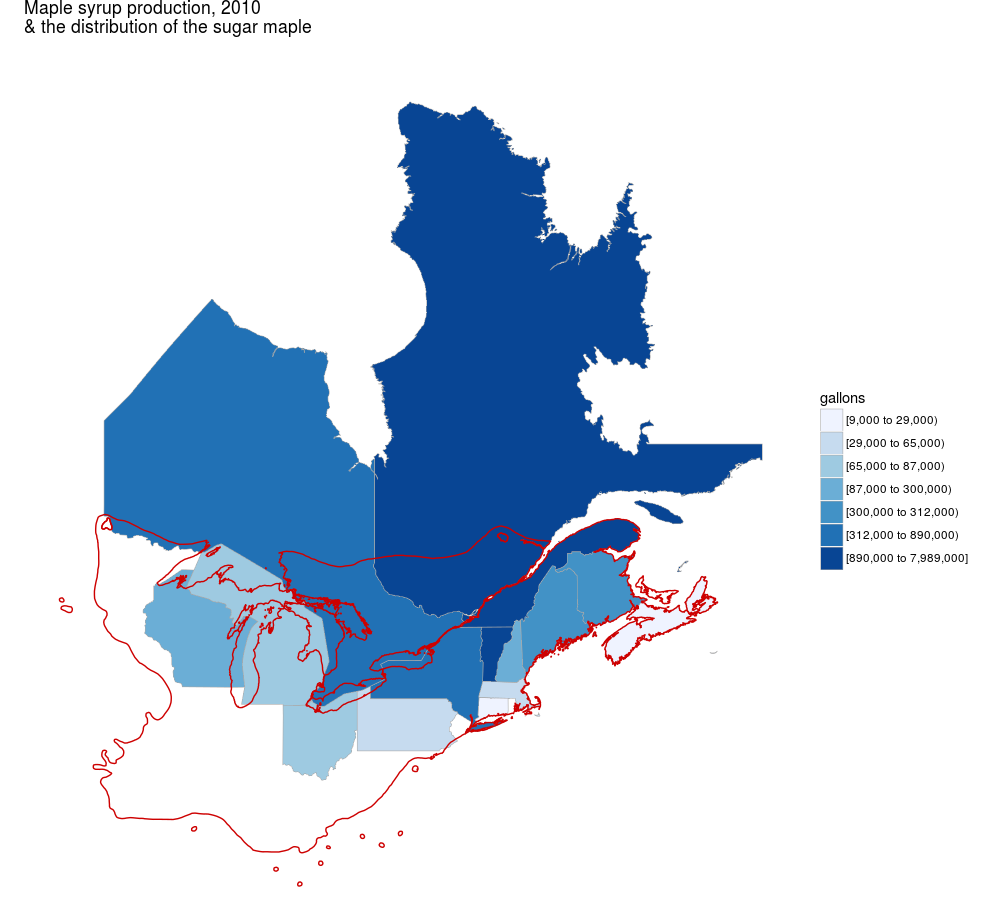
Using the ggplot2 package:
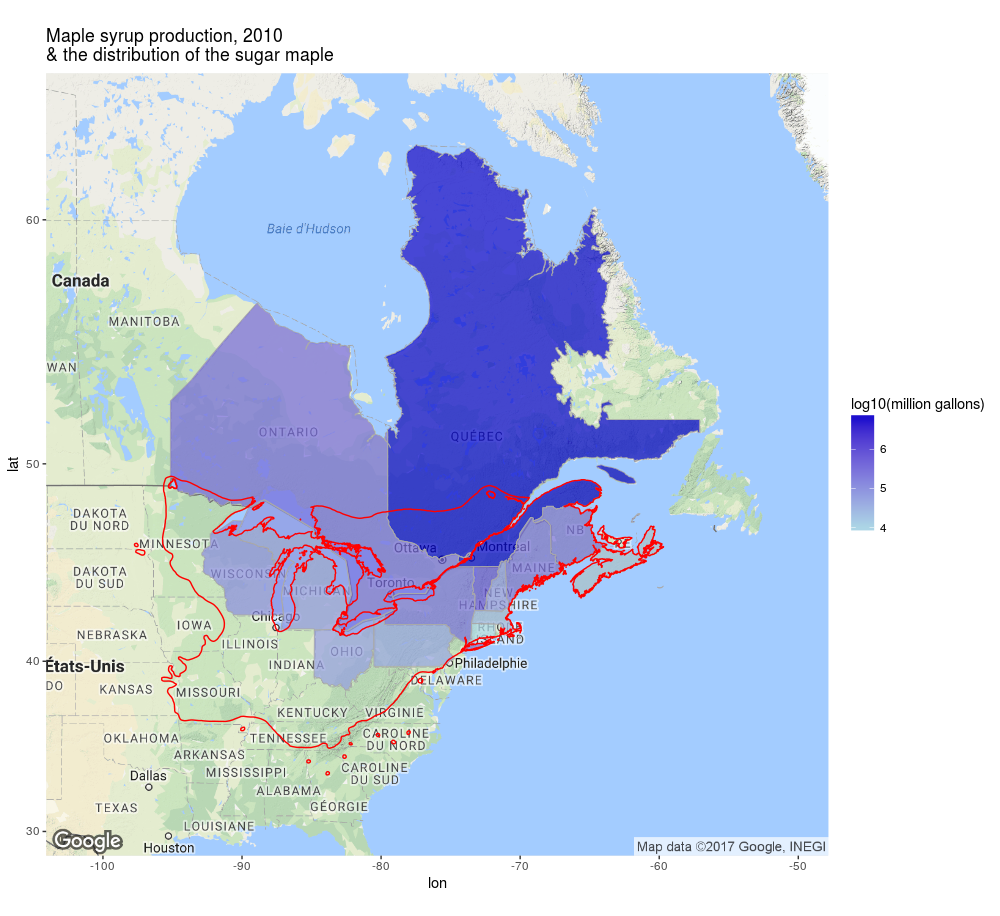
Using the leaflet package:
Colonial Brazil
- Adding spatial vectors or polygons generated with Google Earth (converted into shapefiles with QGIS) to a geographical map.
- Adding markers and circles; these ‘events’ are hard-coded (in the code).
Using the leaflet package:
Joshua Tree
- Adding data points, markers and clustered markers to a geographical map; these ‘events’ come from a data frame (or a database).
Using the leaflet package: